
User Experience is More Than Design – It's Strategy, and Data is the Differentiator
UX professionals have a great untapped potential to turn every project into a successful one, beyond what their traditional role allows them to fulfill. It's time to change the perception of who we are, how we work, and what we can contribute to enterprise innovation.
When it comes to agile-based enterprise programs, most fail. In the energy sector, for example, between 89% and 96% of projects do not deliver business results. The common excuse is lack of user adoption – without wide-scale buy-in, you'll never achieve the productivity increases or cost savings you expect. But user adoption is not so much a problem as it is a symptom. The real issue lies in the project’s approach.
Agile-based methodologies like the Scaled Agile Framework (SAFe) have become de facto as they offer both speed and adaptability. Agile’s focus is on iterative and incremental development so that work is sliced into pieces and each piece builds on top of what has gone before. Compared to the large waterfall methods, it's a great way to stack the bricks of a structure. But it doesn’t address the core problem: how do you know what shape the structure should take, or what the ideal shape is for the people living in it?
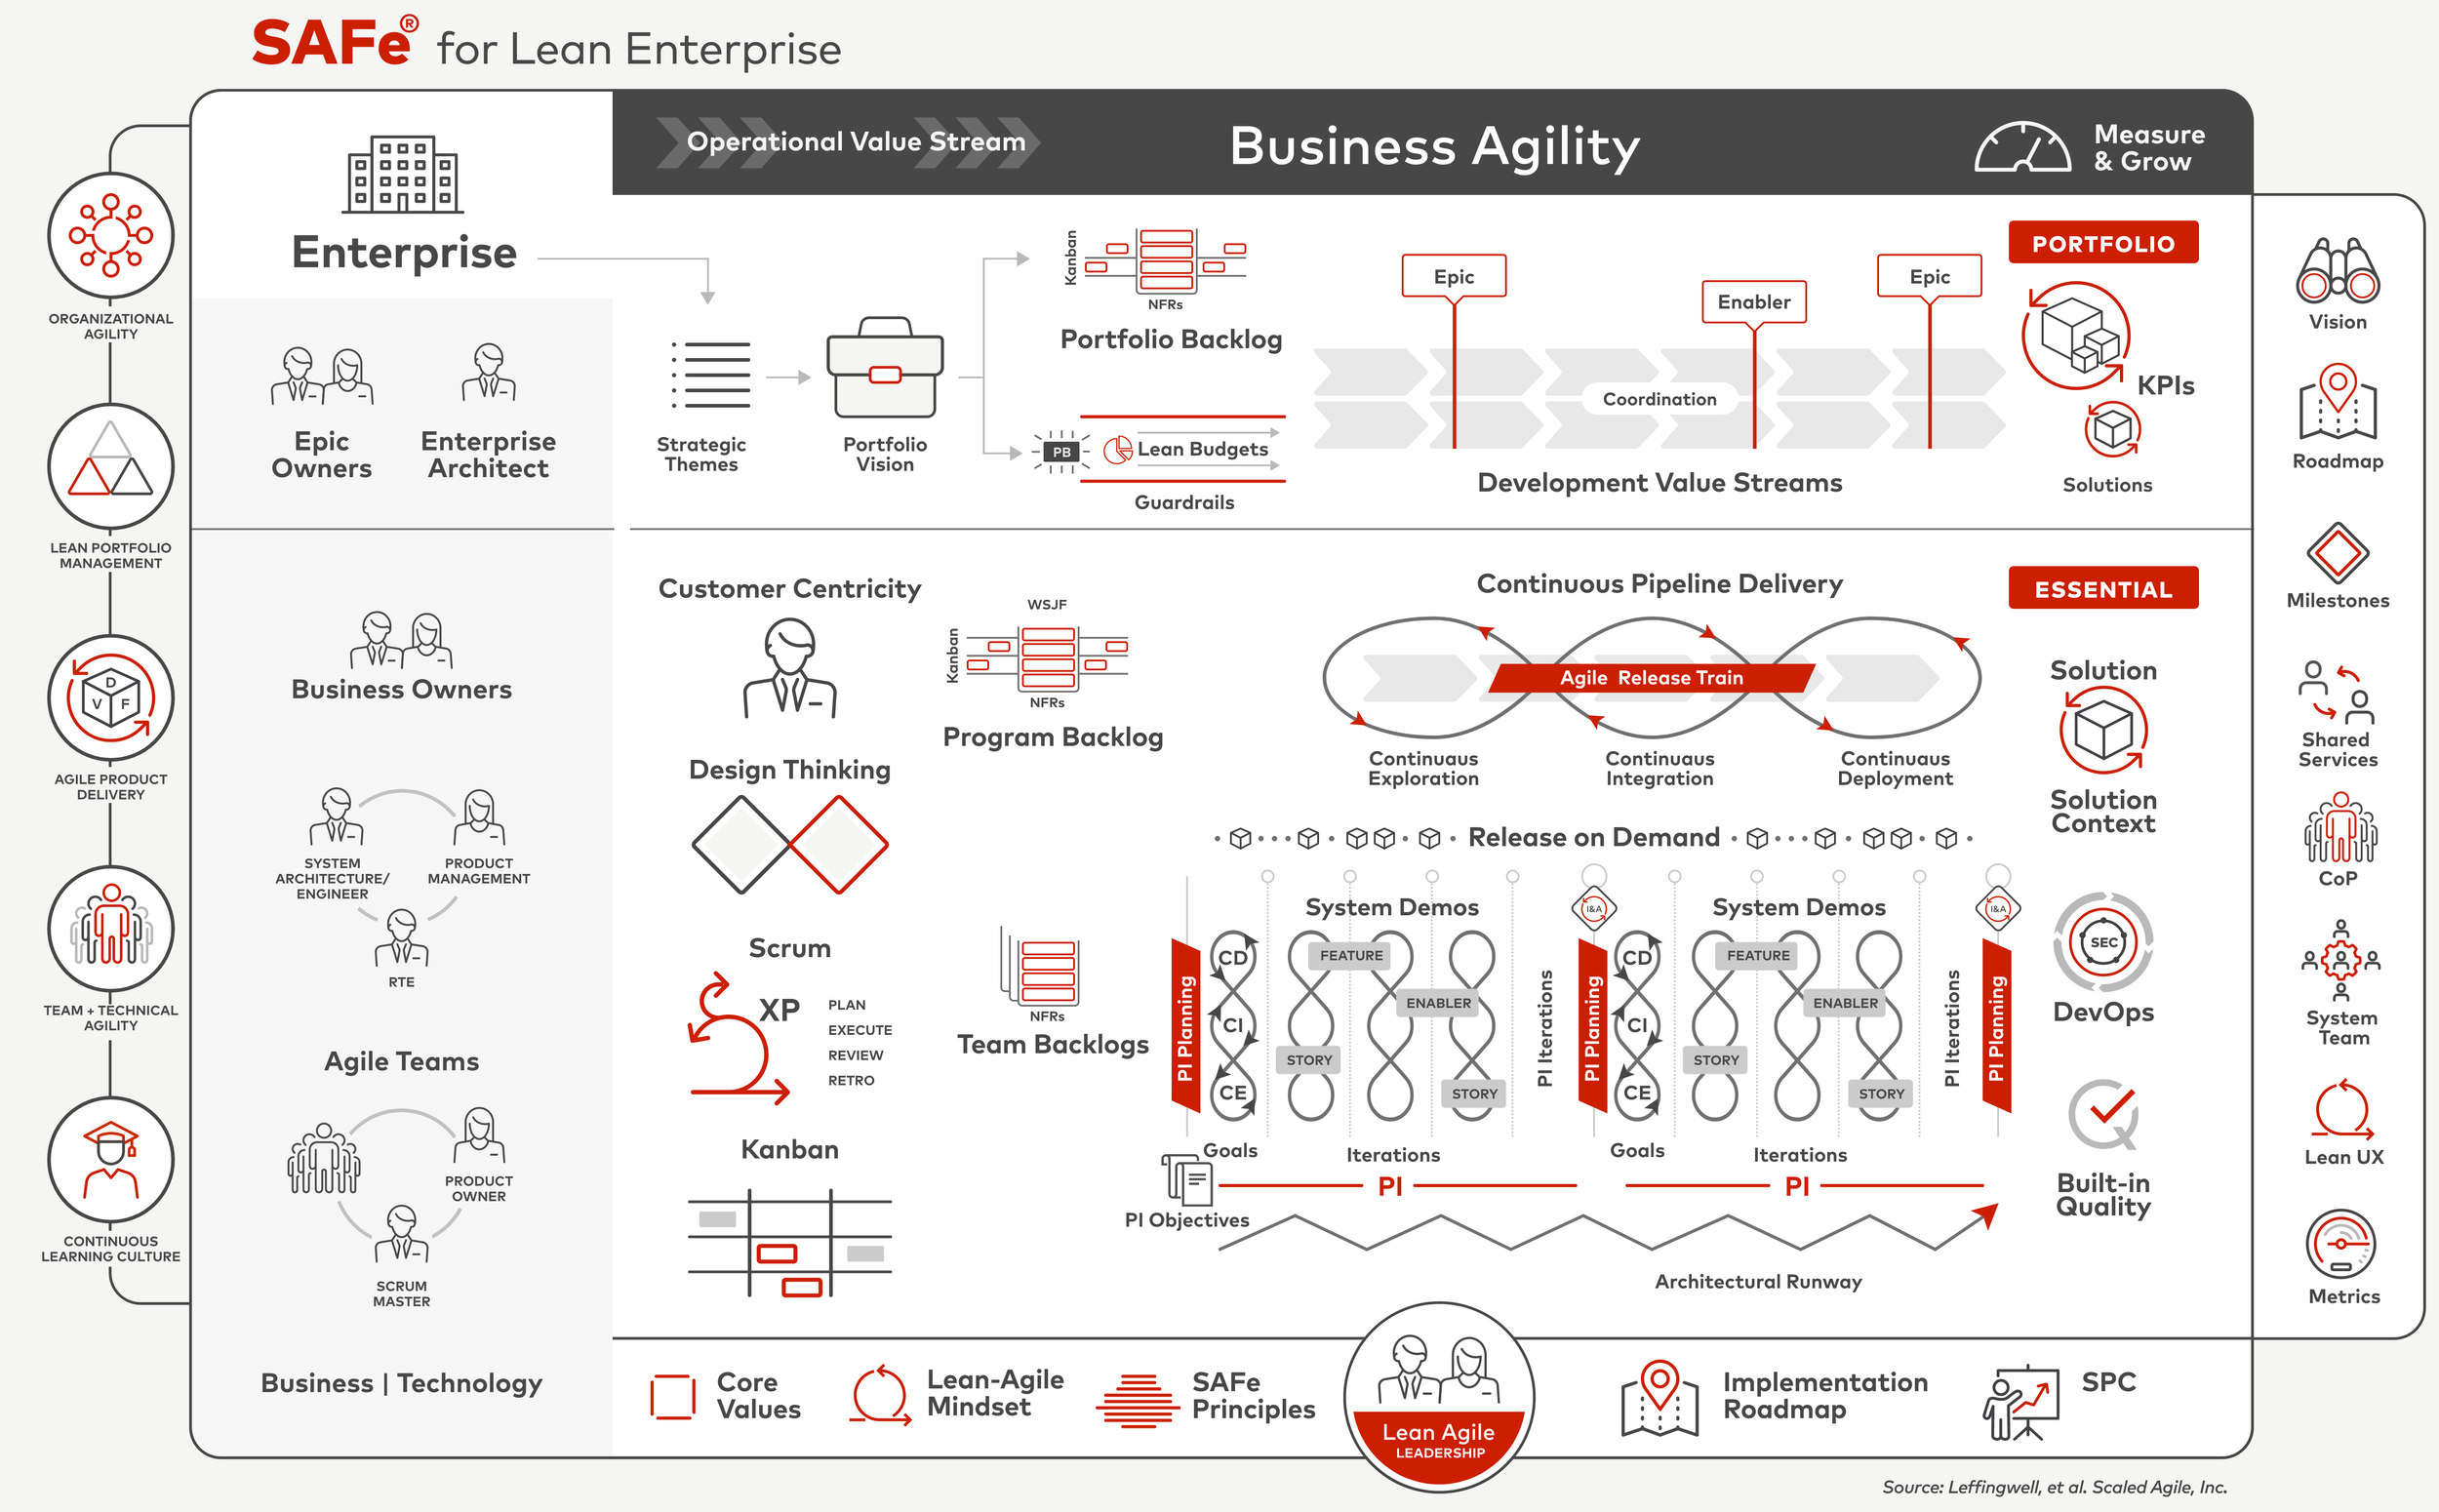
Source: Leffingwell, et al. © Scaled Agile, Inc.
Our methodology offers a fundamentally different approach. Built around SAFe but fixing its problems, and validated by hundreds of real-world enterprise applications, our approach ensures that every single project creates value for end users and is successful in the innovation goals that are set out for it. This is not hyperbole – when we say we've achieved a 100% project success rate, we mean 100% success.

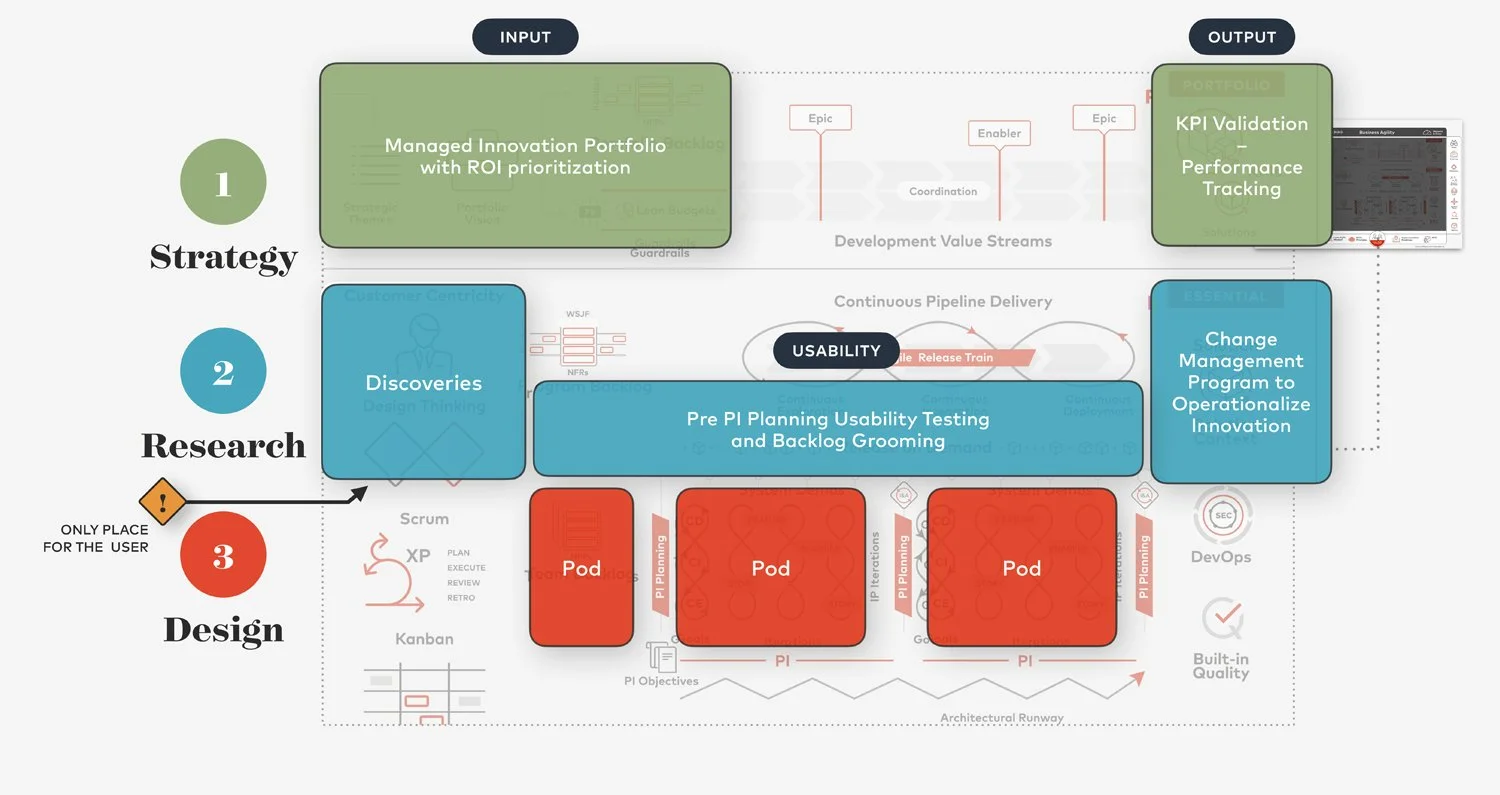
So, what does this look like in practice? For convenience, we're going to break our methodology into three sections: Strategy, Research and Design, with a blog post devoted to each. This first article focuses on the strategy layer. To us, that’s more than just a goal and plan of action – it’s a precise and financially quantified definition of success that gives us a clear roadmap from where we are now to where we need to be, and how to get there in incremental processes with gates and validation along the way.
Lifting designers out of execution silos
First, some context. UX designers are usually brought in to do design work. Their role is about interpretation and execution; specifically, interpreting and executing the strategic decisions that corporate leaders have already made. As such, their work, responsibility and accountability are often circumscribed by pre-determined business goals, product roadmaps, lists of required features and so on, all of which have been decided without a designer present. As a result, the needs of end users – who determine if an innovation is adopted and whether the ROI of a project is realized – are often ignored.
Our approach turns this on its head. Instead of working for product teams, we work alongside them as strategists at the highest level of decision-making:
Performing user-centered discovery as a basis for decision making
Evaluating the risk of choosing various projects and priorities
Creating a business and technology case
Shaping the goals of the project
Quantifying the cost vs returns of specific requirements
Justifying difficult trade-off calls for the business
Having accountability for meeting KPIs
Let’s look at some specific outputs for innovation managers and product teams.
Managed innovation with ROI prioritization
Innovation portfolio managers have the difficult task of allocating finite resources into potentially infinite opportunity arenas, and then into specific projects to deliver strategic innovation goals. Rather than putting all the eggs in one basket, pipeline projects invariably will include a range of risks, resource intensity and revenue potential – the challenge is prioritizing the highest-value opportunities.
With that as our starting point, it makes sense to focus on ROI as the critical basis for strategic decision-making.
In Daito’s methodology, designer-strategists go on-site and assess all the different opportunities to see how they hold up in reality against workflows and user behavior on the ground. The data we uncover allows us to put a value on the opportunity and quantify the financial return against the risk to deliver the project. The output looks something like this, and it helps to ensure that the most important projects get prioritized and funded. If you can prove (and not merely assume) that an opportunity will deliver $20 million a year in savings, for example, it would be foolish or even negligent to pass it up.

Strategic Innovation Assessment
Uncovering valuable new opportunities
When our strategists are on-site, spending days or weeks measuring the ethnography and dynamics of these different project areas, they often discover new opportunities to innovate. These opportunities are rarely on the roadmap as they are not on a decision-maker’s radar. They could only ever be discovered through strategic insights into users and their behavior.
For example, we recently uncovered 68 different optimization opportunities totalling millions of dollars in potential savings and tens of thousands of hours of repetitive work that could be automated. For our partner, this was a real a-ha! moment, and it allowed them to make things better and faster in ways they hadn’t thought about before.
Quantifying the relative importance of features
A key output for us is to take any one of the project bubbles from the chart above and unpack it as a Pareto chart. This shows the cumulative increase in value by requirement set. The bars are ordered in impact from highest to lowest so you can clearly see the relative importance of features. In this example, the first two requirements yield almost 40% of the project’s value; add another two and you're at 75%.
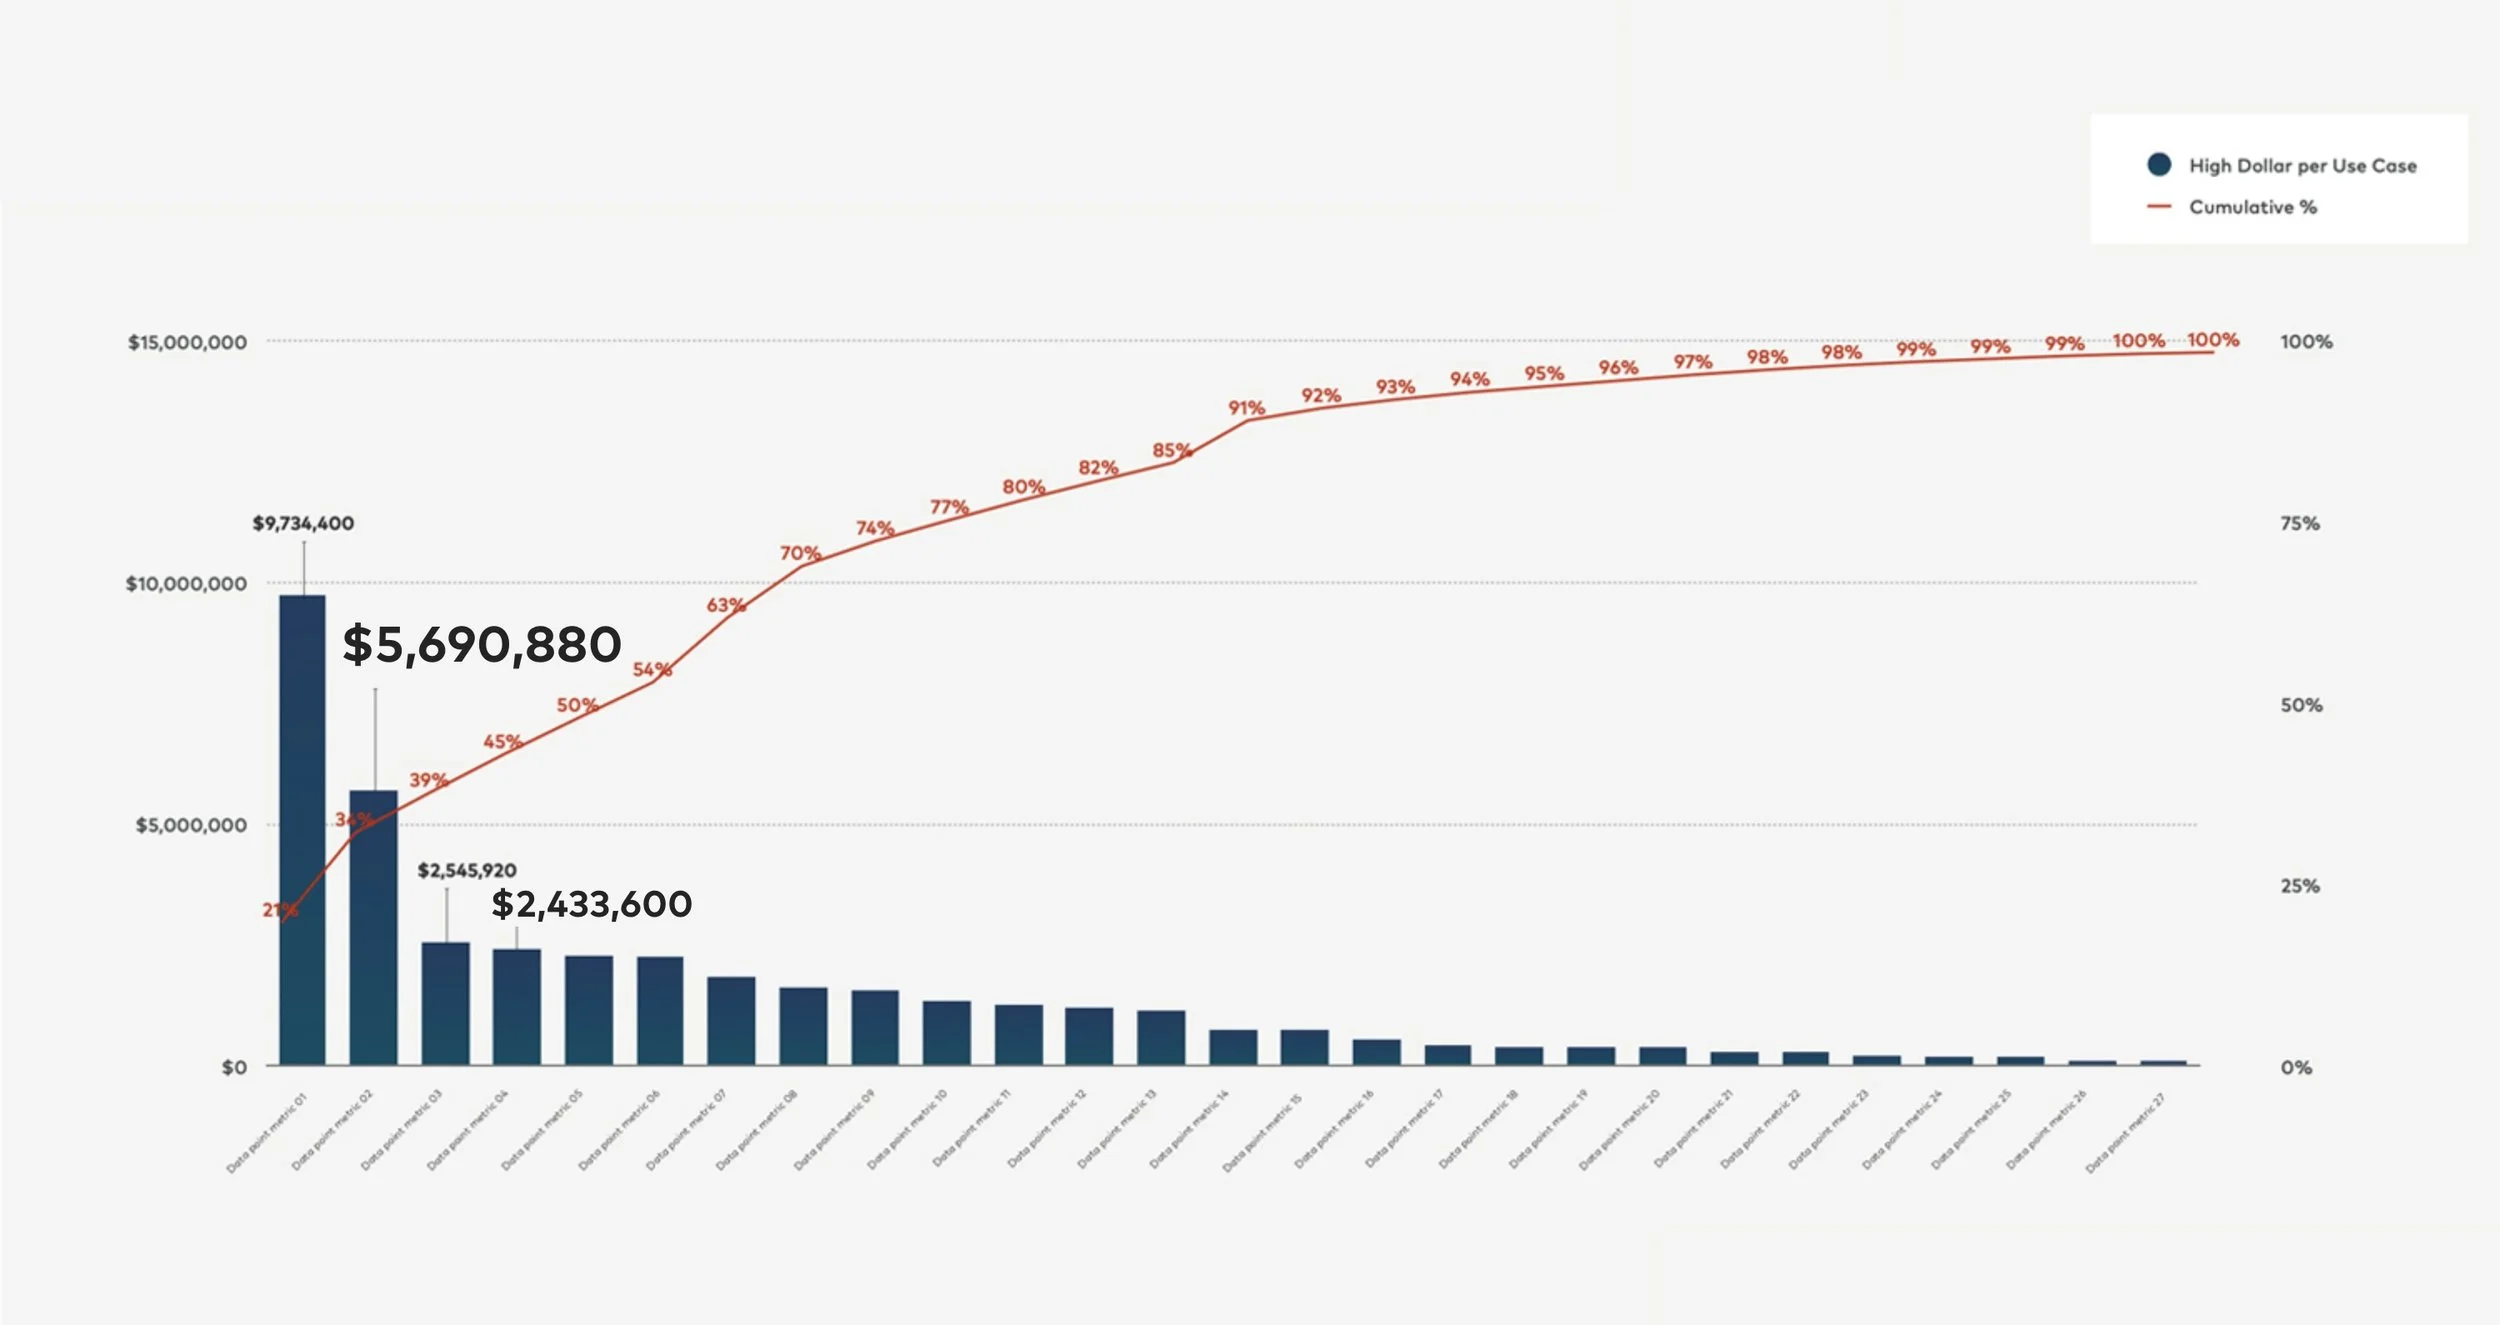
Pareto Chart
When projects fail, it's often because teams are putting huge amounts of effort into features that have minimal impact instead of focusing their attention on the less-sexy features that directly feed into the bottom line. But with all this data in place, innovation managers can point at a budget line item they are going to scratch off against the exact savings or returns that investment will achieve. And teams can be held accountable for doing the right thing against the KPIs for the project.
There’s another benefit to having all this data – it ensures project survival. Too often, we see high-value projects getting canned because key people move on and the political will for the project is lost. With Daito's approach, you know exactly what the KPIs are. You can measure the real-world performance of applications. Everything is quantified, measured and tracked. Data takes the politics out of managed innovation, and that enhances the rate of success.
Creating the proof of concept
As the saying goes: If you have four hours to chop down a tree, spend the first three hours sharpening your ax. Our methodology sharpens the ax through a multi-week discovery process, followed by a proof of concept that makes all the business goals we identified possible and ensures we’re creating enough value for users to offset the pain of change.
Proof of concept is the end result of Daito’s strategy process to show an idea is worth pursuing. A gold-standard POC should be stitched together with data, not duct tape – hence, the full data package with all the KPI “ValiDaiton” goes into the POC engine. Engineers know exactly who the users are, what they’re working on, how much money needs to be saved etc. We can be really intentional about measuring the POC against business KPIs, and so mitigate most of the innovation risk.
NASA has crunched the numbers. They found that getting something right at a strategy level can be 10,000x cheaper than after you've deployed the software. That’s why we experiment, validate and make our mistakes at the least costly point in the process, NOT when it’s gone live.
Final words
There’s a lot going on in the strategy layer, but we’re only talking about eight weeks of discovery and eight weeks of POC. Then you can get straight into designing and developing software that's going to be deployed for five or 10 years. It's a tiny rounding error in terms of the effort involved but in impact, it's the equivalent of getting the engineering drawings for your house checked before you start building. You don't want to be in the middle of that job when you find out you didn't account for a load-bearing wall. Or that your customer wants to live in an apartment.